Author : Ankit Baid, Research Analyst at Affluence Advisory
Where does the market stand??
The last few months were a roller coaster for market, in fact few months? The last few years, we could timeline them for you, starting from
|
Particulars |
Date |
Levels |
|
Pre- GFC Peak |
05-11-2010 |
6312.45 |
|
Taper Tantrum |
28-03-2013 |
5285 |
|
PM Modi gets elected |
16-05-2014 |
7203 |
|
Pre-china de-valuation peak |
03-03-2015 |
8996 |
|
Brexit Referendum |
23-06-2016 |
8270 |
|
Demonetization |
08-11-2016 |
8543 |
|
LTCG Reintroduced |
01-02-2018 |
11016 |
|
Covid – Breakout |
23-03-2020 |
7610 |
|
US-China tension |
31-01-2021 |
13661 |
|
Supply chain crisis |
01-03-2021 |
14624 |
|
Russia – Ukraine War |
24-02-2022 |
16247 |
|
Crude at 100 $ + |
07-03-2022 |
15863 |
|
US Inflation at 8.2% |
13-10-2022 |
16855 |
|
FII Outflows |
31-01-2023 |
17662 |
|
US Bank Crisis |
10-03-2023 |
17412 |
|
Hamas attack on Israel |
07-10-2023 |
19480 |
|
Rate Pause |
31-03-2024 |
21448 |
|
SEBI Commentary on Valuation |
12-03-2024 |
21710 |
|
Iran attacks on Israel |
13-04-2024 |
22259 |
Over the past fourteen years, the global economy has experienced a whirlwind of events, ranging from the arduous journey of post-COVID recovery to the tumultuous aftermath of Russia’s invasion of Ukraine. We’ve witnessed Brent crude surging to unprecedented highs amidst geopolitical tensions, while simultaneously grappling with periods of global economic slowdown. The US dollar index has soared to new heights, reflecting shifting power dynamics on the world stage.
In the midst of these global upheavals, closer to home, the Adani Group has faced scrutiny following allegations reminiscent of the Hindenburg scandal, casting doubt on the integrity of India’s corporate landscape and the efficacy of its regulatory frameworks. These events collectively pose significant questions about the stability and transparency of the Indian corporate structure and the entities tasked with overseeing it.
Following the post-COVID recovery, both indices and investors embarked on a bullish journey, buoyed by optimism. However, the landscape swiftly changed with the Russo-Ukrainian conflict, unleashing a series of global hurdles. From a deceleration in global growth to soaring inflation rates unseen in decades and record-high interest rates, the challenges seemed relentless.
Despite this turbulence, the Indian stock market has displayed remarkable resilience in recent times, defying expectations and demonstrating an impressive capacity to absorb shocks. This resilience marks a notable departure from its past performances.
A comparative analysis of returns across global indices during the last 1 year as on date.
- Nikkei +29.77 %
- Nasdaq: +26.72%
- India: +25.366%
- Dow Jones: +12.43%
- S&P 500: +20.28%
- FTSE: -0.09%
- Hang Seng: -20%
- MSCI EM -5.05 % vs +13% India (3 years)
Nifty’s journey from its peak of 6357.10 in January 2008 to its current pinnacle of 22259 in April 2024 returns > 3x. However noting nifty’s long-term compounded annual growth rate (CAGR) of 14%. Contrastingly, the CAGR over the past 15 years stands at a mere 7%, indicating a slower pace of growth in recent times.
Despite this uncertainty surrounding, there’s optimism surrounding Nifty’s potential to catch up to its long-term average (LTA) growth rate. With current high-frequency indicators signalling favorable economic conditions, coupled with government initiatives promoting infrastructure and manufacturing sectors, including Production Linked Incentives (PLIs), and the burgeoning success of the services sector, India appears poised for substantial growth in the coming decade.
When evaluating price valuations, it’s essential to consider both market perceptions and investor sentiments. The Indian market often commands a premium, presenting investors with a trade-off between perceived valuations and the potential for growth, both at the sectoral and individual stock levels. Adding to the above observation the CAGR returns have varied across decades. No two decades have returned the same CAGR, despite numerous stocks generating multibagger returns across these decades.
So, that clearly erases the fact that we should stop being index cautious and try playing across themes. India experienced a decade of below-normal returns from 2010 to 2020, marking a significant departure from historical trends. Illustratively, an investment of Rs 100 made in 2010 yielded only Rs 245 by the end of the decade. This stands in stark contrast to the robust returns witnessed in earlier decades, such as the 1980s it returned up-to 700 Rs at end of the decade.
This statement is really important given the uncertainty and market participant’s expecting steep correction. Any correction seems a minor blip when you look from a long term perceptive. The risk of investment is not investing and rather staying invested in the markets. Believe these 3 positive triggers would strength the market confidence
- The DII’s cushioning the market – strong SIP’s flows (18k crore, but that’s a 0.425 % when you compare with $4 Trillion market capitalization)
- FII decadal low holdings- Providing valuation comfort
- Strong Institutional framework and governance, embracing technology.
Also Read: Gold Price is shining- Know the reasons
Market outlook

Believe the index rally from now on would be narrative based varying from, Q4 earnings, Gold price rally, interest rates, Bond yields, general elections.
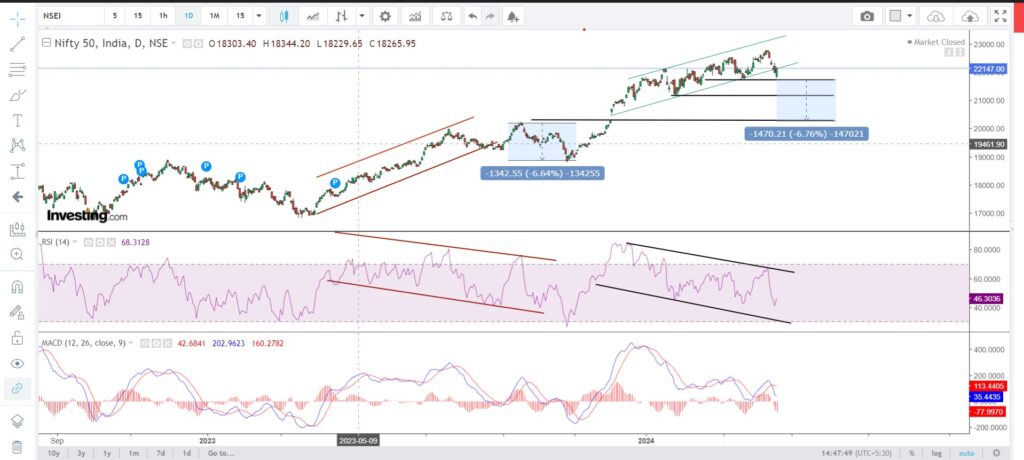
The levels are clearly depicted in the chart, feel that the index is replicating the earlier movements, RSI divergence, and the trend of the candles depicting higher high and higher low. Believe a close below 21800 would lead to huge sell off. Those level already being tested on 20.04.2024. That’s the major and 1st support level and thereby in worst case scenario a 6% fall as shown. Resistance at 22250 and 22400 levels. Keep buying irrespective to the movements, money is there in there in long run and short too but that comes with a cost, either monetary or emotional.
21800 is to be sustained on closing basis.
Markets now are dwindling in a range, neither upside nor downside, but one could look at theme such as Capital goods, Electrification, Manufacturing, Auto, FMCG (Contraction view), because whenever the agricultural and commodities price decline it aids the FMCG sector. The S&P Agricultural index is at 2 year low and noting that FMCG has been underperformer when compared to Nifty.

Rather than adopting a short-term trading mentality, investors are encouraged to adopt a long-term perspective, focusing on yearly growth trajectories. It’s within this extended timeframe that the most significant wealth-building opportunities lie, emphasizing the importance of patience and strategic planning in navigating the complexities of the market.
Disclaimer: This article provides general information existing at the time of preparation and we take no responsibility to update it with the subsequent changes in the law. The article is intended as a news update and Affluence Advisory neither assumes nor accepts any responsibility for any loss arising to any person acting or refraining from acting as a result of any material contained in this article. It is recommended that professional advice be taken based on specific facts and circumstances. This article does not substitute the need to refer to the original pronouncement
CLICK HERE DOWNLOAD PDF


